Business Intelligence
Power Visual Analytics
Visually stunning. Strategically powerful.
This is how the Business Intelligence systems we create at Mistral are.
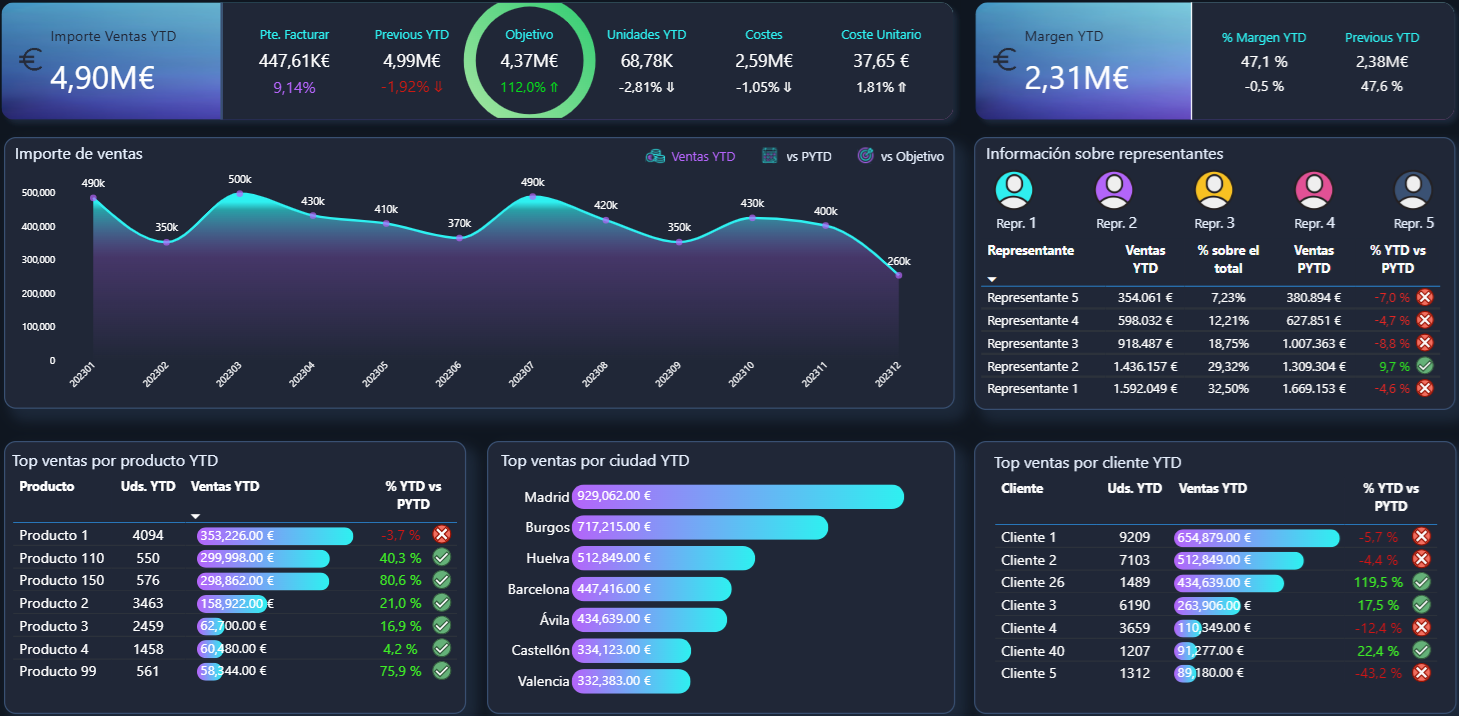
We design dashboards that are not only beautiful: they are built to provide clarity, focus, and decision-making ability.
We transform data into visual and strategic knowledge so your company can see more clearly, act faster, and make better decisions.
If you don’t make decisions based on data, you’re deciding blindly
Nowadays, managing without data is taking an unnecessary risk.
Las empresas que no tienen una estrategia de analítica clara pierden visibilidad, agilidad y capacidad de anticipación.
A good Business Intelligence system allows you to detect what is working, correct what is not, and anticipate what’s coming.
It helps you grow, optimize resources, and align your entire team with the same objectives.
“BI allows us to grow and provide better service every time”
– Mistral Client
What Business Intelligence brings
When BI is done well, it shows.
Not just in the data you see, but in how it changes your decision-making process.
Key advantages of having a good BI system:
“We’ve gained visibility and substantially improved our decision-making intelligence, in addition to reducing the costs of resources dedicated to reporting.”
– Mistral Client
Our proposal: Power Visual Analytics
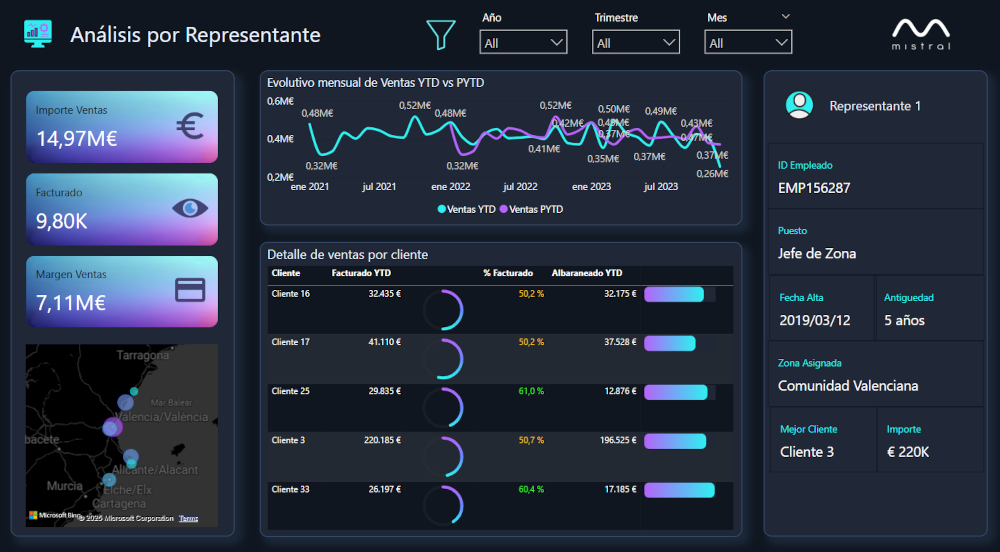
At Mistral, every dashboard has a purpose.
We create solutions that combine powerful analysis with an impeccable visual experience.
Our dashboards are easy to read, quick to understand, and entirely business-focused.
They deliver exactly the information you need, when you need it.
“Mistral helps us turn our business problems into dashboards and insightful reports, by identifying the core of the problem, defining technical requirements, and creating dashboards that show knowledge derived from data.”
– Mistral Client
We master what’s visible... and what’s not
A BI system doesn’t always need a Data Warehouse. But when it does, it’s crucial that it’s well-built.
At Mistral we are experts in both data visualization and data integration, as well as creating scalable, clean, and maintainable data architectures.
When we implement a Data Warehouse, we do so with a long-term vision: thinking about scalability, ease of maintenance, and especially data governance.
Because what’s not visible on a dashboard... also matters.
We live BI every day
At Mistral we’ve been helping companies of all sizes and industries make better decisions based on their data for years.
It’s not a trend for us. It’s what we do every day.
We have the experience, the team, and the methodology to turn your data into a real strategic tool.